Building a Solar Panel Dashboard with Raspberry Pi and Python - Part 1
I didn't get a fancy phone app that shows power flow from the panels, along with power generated during the day, power for the month, etc.

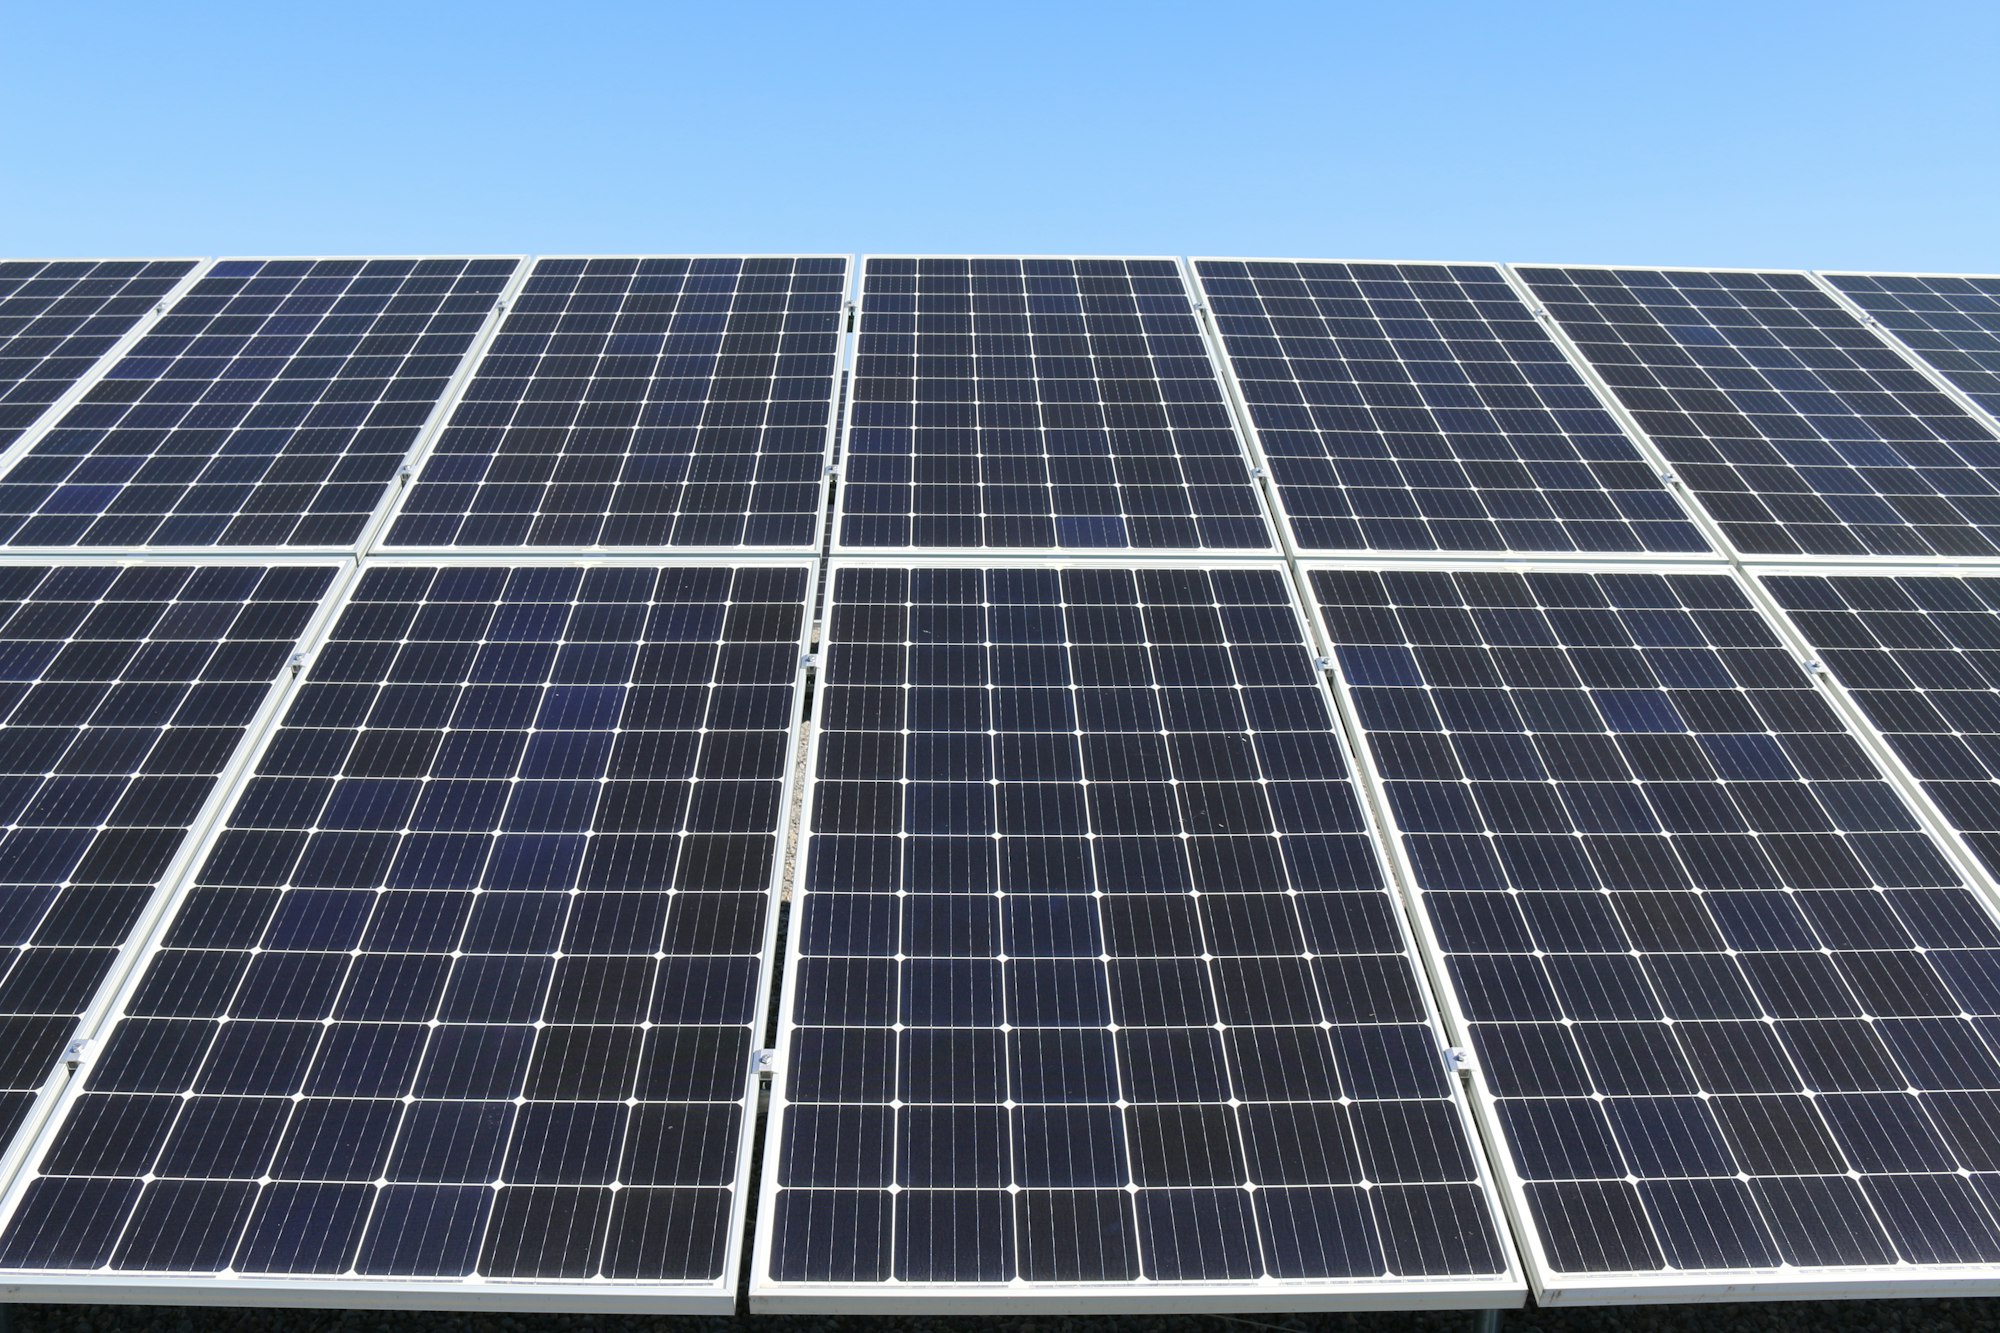
I have always loved the idea of having solar panels on my roof. Anything that can help make my home more self-sustaining is a big plus in my book. Last year, my wife and I took the plunge and had 20 panels installed on our house.
There is a huge catch with most residential solar panels though.
It is common to think that if the power goes out, your panels will be generating power. This is true. The catch is power may not be flowing into your home from the panels! You see, (at least in Utah) the panels are connected to your meter box with what is called a "Net Meter" - an electrical meter that goes both ways: it goes one way when you are pulling power from the grid, and the other way if you are feeding excess solar power into the grid. This is great because we get credits for all the power we feed back into the grid, offsetting our power bill. My highest power bill this year was less than $40 (despite the hot summer). If the grid goes down, however, solar power does not automatically flow into your home.
To keep electricians working on grid equipment safe, power stops at the meter. If it did not, then the power company could shut off power for an emergency or maintenance, but a whole bunch of houses would still be dumping power into the wires that electricians need to work on. Having been an electrician myself many years ago, this is problematic.
I Want to See My Solar Data!
We found a solar company that installs a special inverter that feeds power to an outlet if the grid goes down. This is exactly what we wanted - a method of power generation when the grid goes down. The downside? I didn't get a fancy phone app that shows power flow from the panels, along with power generated during the day, power for the month, etc.
Sure, there is a website you can go to for this information, (the inverter is connected to our home network and reports its metrics offsite) but the site leaves a lot to be desired. I figured there had to be a way I could just get the data from the inverter directly, and display it somewhere.
Not surprisingly, I'm not the first one to attempt something like this.
Open Source To The Rescue
My inverter is a unit made by a company called SMA. While surfing the web looking for manuals or information about the inverter's API, I came across a GitHub repository belonging to a developer named Dymerz. They have created a Python library that contains mappings for all the commands needed to interact with my inverter. Perfect!
Better yet, once I plugged my unit's information into the configuration, the library worked right out of the box. Always a bonus, and a testament to the skill of this developer.
How to Display The Data?
Ideally, I would like to have a display somewhere in my kitchen so at a glance I can see what the current production is, along with any other metrics that may be of interest at any given time. I happen to have a spare Raspberry Pi 3 Model B+ lying around collecting dust that would be perfect for the job.
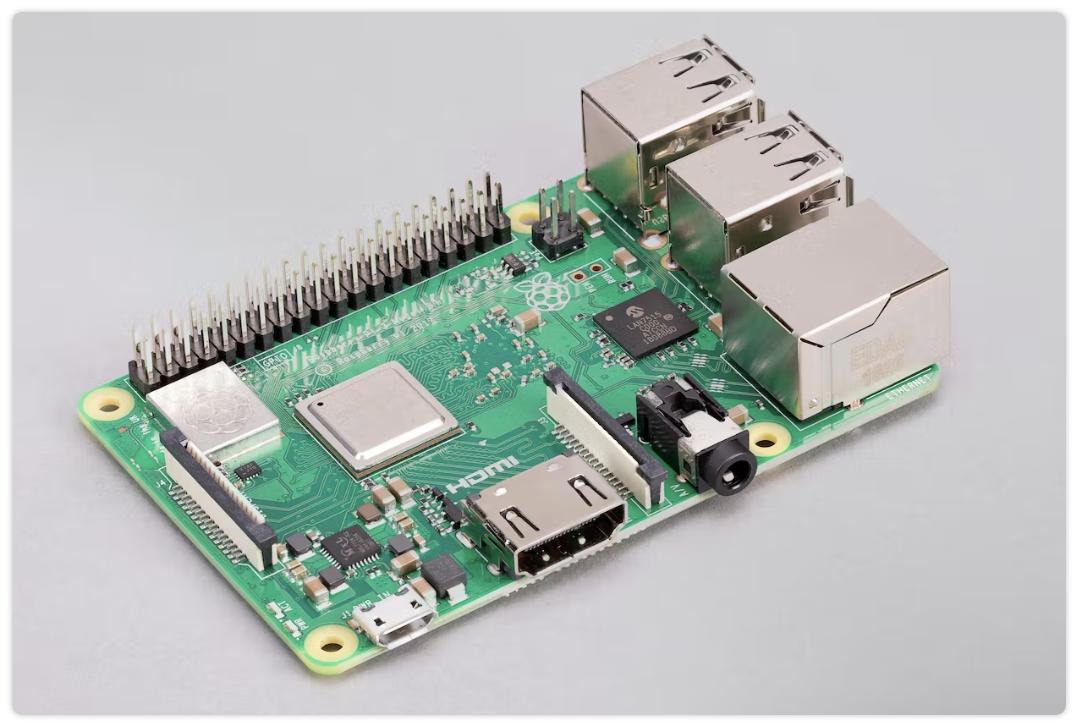
The Raspberry Pi is a fantastic tiny computer that is perfect for applications like these. Better yet? Since I already had one, I found a fairly cheap 7" touch screen that I can connect directly to it.
I also happen to have a 3d printer and there is no shortage of freely available Raspberry Pi cases for printing. I found one on thingiverse.com that fit my needs pretty quickly.
Now I just have to write the software to show all the data from the solar inverter.
Building a Dashboard - Attempt 1
My employer was hosting a three-day "hackathon" where all developers can work on any project they want, business-related or otherwise, so this was the perfect opportunity to put some time into this project.
I've been a web developer for most of my career so my natural reaction to the need for a UI was to build something that I could run in a browser. I figured I would just run an HTTP server on the Pi with endpoints that serve up the inverter metrics I want. I could then show them in a browser in a web UI with fancy bars and stuff.
It had been a while since I'd done any kind of UI development (these days I'm a backend developer, which I love!). Not wanting to waste any time playing with unfamiliar technologies, I reached for something I was familiar with - the Angular framework.
It worked perfectly. Within a day, I had a working UI with dummy data.
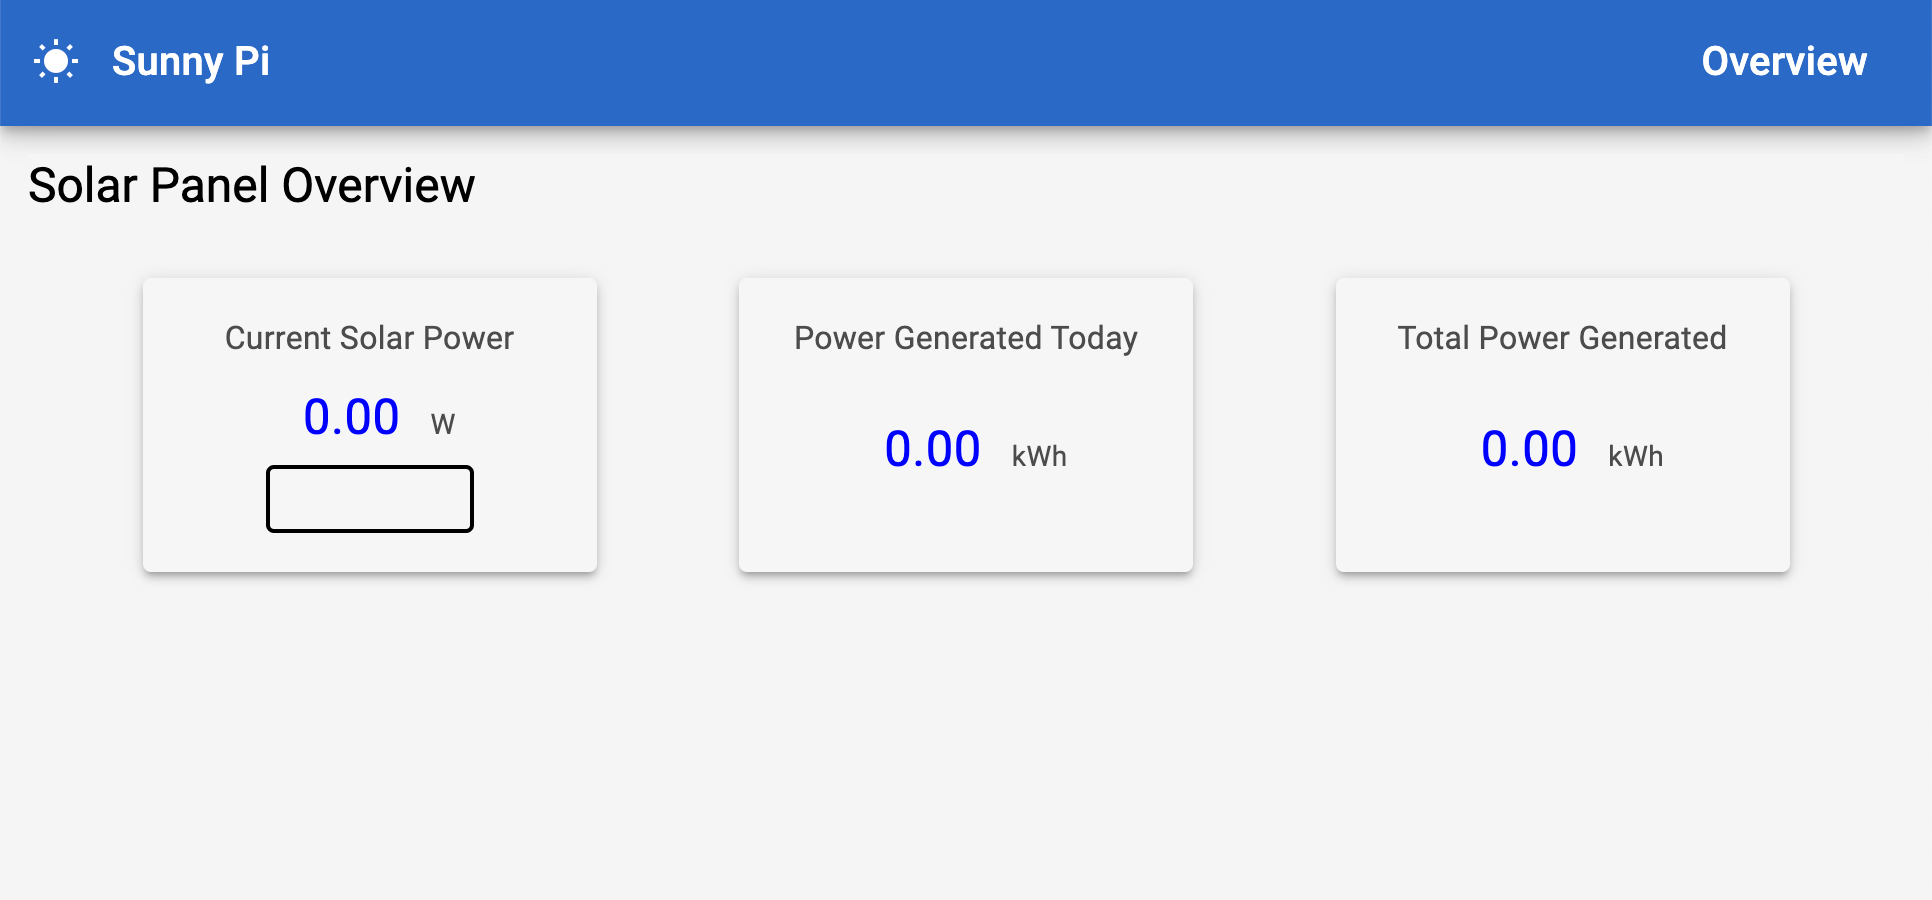
Then I tried to run it on the raspberry pi, and it completely choked.
I'm not sure what exactly the problem was, but I couldn't even get it to load in the Pi's browser with the dummy data. I may have overestimated the amount of power the Pi had.
Web Architecture Should Not Be Forced Into Everything
Well duh. Why would you do something like that?
I should have told myself that sooner.
Not only did I have a UI that wouldn't work with my Pi, but I also started thinking about the extra work I was creating for myself with this approach. Not only did I have the UI in a separate language and platform than my data source (Python), but I would have to add a whole bunch of extra code libraries to my Python application to make it consumable by the UI.
Further, to have the dashboard start automatically, I would now need a more complicated startup script because I had to not only start the "back end" as an HTTP server, I would then have to have a browser automatically start and navigate to the web address of the UI, and make sure the front-end and back-end could talk to each other.
That's way too much work.
Next Steps?
Now that the hackathon is over, I've decided to do things the smart way. Turns out the adage of the best way usually being the simplest way holds true in my case here as well.
I'm going to start learning Python's Tkinter library to build a UI for my dashboard. Coupling that with my fork of Dymerz's excellent library, I'll only have to start a single application when the raspberry pi boots up, and everything will be ready to go.
I'm still working on this, so stay tuned for a future update on the project!